Trend returns in copper: a tale of two markets
Taking a closer look at different returns on positions in the same trends.

Taking a closer look at different returns on positions in the same trends.

So far, 2025 has been quite a difficult year for trend following strategies like our Diversified Trend Program (DTP). One of the trickier markets has been copper. Or should we say, two markets? Copper and copper aren’t quite the same anymore! This has led to the diverging price moves in the copper market we’ve observed recently and might also partly explain the remarkable performance differences seen between usually highly correlated trend programs.
Such dispersion is, of course, always rooted in different managers making different choices. But one might wonder if all these choices were made with an eye on the nature of the events that recently drove the copper market. In this article, we’ll dive into some of these choices and explain why they might have led to significantly different returns for the various trend programs that traded copper. We’ll limit our analysis to the four months from April to July, broken down into three periods: 1 April to 9 April, 10 April to 2 July, and 3 July to 31 July.
Most of the trend programs that trade copper will do so on the Chicago Mercantile Exchange (CME) and/or the London Metal Exchange (LME). There can be all sorts of reasons for choosing one or the other or both, but most of the time this choice doesn’t really make a difference. This was also the case in the first week of April. Since the start of the year, copper prices were on the rise, so it’s likely that most, if not all, trend programs began April with long positions in copper. And all of these programs will have lost on these positions in the broad market sell-off following ‘Liberation Day’.
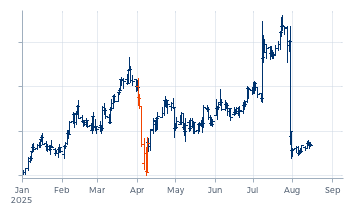
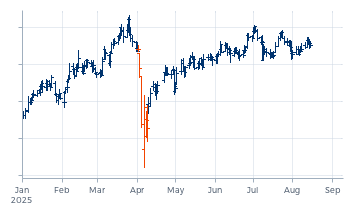
We could dive into a detailed analysis of different trend models — faster versus slower, and so on — but the performance differences between the various programs in this sell-off are most likely predominantly explained by the size of the positions each program held. And in an environment like this, position sizes are typically not determined by the characteristics of the trend indicators used. Instead, they will mainly be the result of the applied risk allocation principles. And these principles are typically different from manager to manager, and from program to program.
In DTP, we tend to allocate more risk to commodities than most other trend programs seem to do. From this perspective, one might expect that DTP would have lost more in copper than most other programs. However, this larger allocation to commodities is based on correlations: commodities are often decorrelated to the largest financial markets. But this is less true for base metals than, for instance, for most agricultural markets. And therefore, more of DTP’s risk is generally allocated to agricultural markets than to base metals.
This diversification didn’t really protect the program after Liberation Day. DTP indeed lost on its long positions in base metals — in addition to copper also significantly in tin. But it lost more on long positions in precious metals, and even more on long positions in coffee and sugar. It also lost more on long positions in livestock than it did in base metals. And the losses weren’t limited to commodities. DTP also lost on long positions in U.S. and European stocks, short positions in Japanese bonds, and short positions in the euro and the Swiss franc. On each of these positions, DTP lost more than it did in copper.
Essentially, in a broad market move like the one after Liberation Day, it isn’t really relevant how much a specific program loses on an individual position, such as in copper. It’s the sum of related losses that counts (and hurts). We estimate that most trend programs will have lost on largely the same positions as DTP did. The total loss on these positions would have been smaller if the total risk allocated to these positions was smaller. How could that have been accomplished? If it is the result of always allocating less risk to all positions, it effectively just means lower leverage, implying the (potential) upside is limited by the same factor as the downside.
Achieving real outperformance would have required an approach that specifically sized down positions in the markets that reversed direction in response to the tariff announcements. We can’t rule out the possibility that some managers anticipated and acted on this. Generally speaking, this would require a conditional scenario-based correlation assessment — which markets will correlate with which others in various scenarios. Theoretically, this sounds fantastic. But in real life, there’s a catch: what if the actual scenario that unfolds wasn’t included in the analysis?
In the diversification-based approach that guides the risk allocation in DTP, we strive to profit from positions in other markets to offset (part of) the aggregated losses on positions in the reversing markets. We know this offers no guaranteed protection. In this specific case, such profitable positions included short positions in iron ore and European emission allowances, long positions in short-term eurozone and U.S. bonds, short positions in the Chinese renminbi, short positions in U.S. stocks such as those in the oil industry and biotechnology, and long positions in the VIX. However, this was merely a band-aid on a bullet wound.
It may sound a bit counterintuitive, but we would argue that in a scenario like this — an unprecedented large global event — more diversified programs will generally lose more than less diversified ones. The reason for this is that less diversified programs won’t assume the diversification benefits that the more diversified programs will likely overestimate. At least, in the short term.
Copper prices bottomed on 9 April with the announcement of a 90-day pause on the ‘reciprocal tariffs’ (except for those on imports from China). Following this announcement, markets began to recover from their initial tariff shock. By early July, copper prices had bounced back to the levels they were at before Liberation Day.
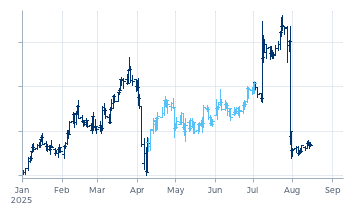
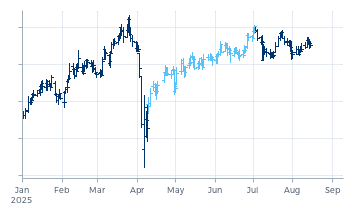
While differences in trend models are likely not the main explanatory factor for the large performance differences observed during the sell-off, they most likely did result in widely varying positions at the start of the recovery. For instance, classical stop-and-reverse type strategies may have switched from long to short positions in copper during the sell-off. Trend programs that combine shorter-term and longer-term models may have entered shorter-term short positions that partially or fully offset their remaining longer-term long positions. And other approaches may well have responded yet differently.
At the start of July, most, if not all, trend programs were probably long copper again. However, the divergent positioning after the April sell-off — including when and how potential short positions in copper were reversed back into long positions again — likely resulted in significant performance differences between the various programs. And this disparity wasn’t just due to the positions in copper. Just as Liberation Day impacted many markets beyond copper, the announcement to pause the implementation of the tariffs had a similar widespread effect. The way different programs adapted their positions in for instance other commodities and in stocks likely contributed even more to the variation in performance.
In the diversification-based approach of DTP, we strive to make the applied trend indicators robust enough to not (massively) reverse positions in response to large events that (temporarily) impact many markets. Our goal is to preserve the actual diversification in the portfolio. The various market moves following Liberation Day illustrate this reasoning. If DTP had reversed all losing positions in the markets shown in the first carousel of price charts (the long positions in commodities and stocks, and the short positions in Japanese bonds, the euro, and the Swiss franc) and held on to the winning positions in the markets shown in the second carousel, the portfolio would have effectively been narrowed to one large reciprocal tariffs bet. In the weeks following the announced tariff pause, this would have resulted in losses on all these positions (except for the newly entered short positions in sugar).¹
By preserving the portfolio’s diversification, DTP avoided further losses after 9 April. In fact, the (hopefully) lowest point in the program’s current drawdown was already reached on 7 April. From that moment on, the diversification that initially didn’t mitigate losses finally started to pay off again. The profits since that date have come, among others, from long positions in copper. But these gains have not yet been enough to make up for the earlier losses. This holds true for both copper and the program as a whole.
So, different trend models responding differently to the broad sell-off after Liberation Day can explain the performance dispersion observed after 9 April. But this situation only lasted a few weeks. By then, we expect most trend programs to have largely realigned with the same trends. From that point onward, we estimate that the primary difference between the various trend programs will have been the amount of risk allocated to the specific markets within these trends. For instance, some programs might have allocated more risk to long positions in stock markets again, while others might have allocated more risk to long positions in commodities. And which specific stocks and which specific commodities received the largest allocations?
Different choices in this respect may not have made a significant difference during the broad sell-off after Liberation Day, but in the period that followed, these choices increasingly had an impact. One important reason for this was that the announced tariff pause definitely did not imply “90 days without trade disputes”. And these disputes continued to have market impact, sometimes causing what we define as ‘extreme’ market moves. However, unlike the period immediately after Liberation Day, these moves were much more contained. Here are some examples:
The U.S. accused various Asian countries of keeping their exchange rates artificially weak to support the export of their goods to the U.S. Statements urging a reversal of this policy on 11 April and 2 May resulted in fierce rallies in the Thai baht, the Taiwan dollar, and the Korean won — also against currencies other than the U.S. dollar — but had no significant impact on other markets.
On the first business day of June, the sudden announcement of 50 percent tariffs on steel and aluminium imports into the U.S. resulted in an extreme price rise for steel within the U.S. and an increase in the stock price of U.S. steel producers like Nucor, but barely impacted other markets.
On 9 July, Brazil received a letter explaining that, starting on 1 August, U.S. imports from Brazil would be subject to a 50 percent tariff. Earlier, on Liberation Day, this tariff was set at only 10 percent because the U.S. maintains a positive trade balance with Brazil. Although this change was surprising, it only impacted Brazilian markets.
On 15 July, threats of 200 percent tariffs on pharmaceuticals only impacted the pharmaceutical sector.
With such local market moves, it can make a significant difference whether positions in a euro uptrend are held against short positions in the U.S. dollar or against short positions in Asian currencies. Or similarly, whether positions in a U.S. dollar downtrend are held against the Brazilian real or other currencies. Or whether long positions in stocks are held in steel producers, pharmaceuticals, or European banks. But also the extent to which a program is short dollar against other currencies, against commodities, or both. Different trend programs, even when largely trading the same trends, can exhibit significant differences in this respect.
Copper imported into the U.S. was one of the elements in the U.S. trade disputes. The White House had already mentioned potential tariffs on these imports back in January, which immediately began to impact futures prices. The price for copper delivered in the U.S., as traded on the CME, rose above the price for international copper traded on the LME. The more resolute the tariff announcements, the higher the premium climbed. On 5 March, the White House announced that the tariffs on copper would be a significant 25 percent.
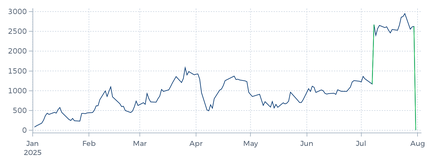
This growing price difference between U.S. copper and international copper wasn’t just speculation by futures traders. The large physical market in the U.S. was also actively preparing for the anticipated tariffs. Shiploads of copper were imported into the U.S., building inventories ahead of the tariffs. This drained inventories elsewhere, even leading to a squeeze on the LME — a price spike in the spot contract — on 26 June.
We don’t believe that this squeeze significantly impacted trend programs. Similarly, we don’t think that the increased premium of CME copper caused notable performance differences between programs trading CME copper and those trading LME copper. Both markets were trending, and trend programs will have profited in either one.
This changed on 8 July when the White House announced that the tariffs on copper imports would be set at 50 percent instead of 25 percent. This announcement spurred a record spike in the CME contract, while the LME contract — which had already settled for the day — dropped the following day. With such price moves, it can make a significant difference whether a program is long U.S. copper or long international copper.
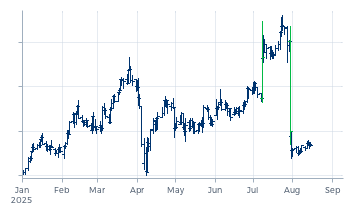
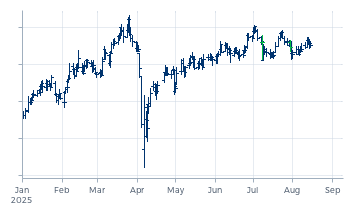
As it turned out, the differences could be even larger. Three weeks later, the White House officially published the announced tariffs. The proclamation indeed imposed ‘universal’ 50 percent tariffs on imports of copper, but only “of semi-finished copper products (such as copper pipes, wires, rods, sheets, and tubes) and copper-intensive derivative products (such as pipe fittings, cables, connectors, and electrical components).” Not of “copper input materials (such as copper ores, concentrates, mattes, cathodes, and anodes) and copper scrap.” Since the futures market is tied to copper cathodes, this effectively meant no tariff. That was not what the market had anticipated. In response, CME copper collapsed by 20 percent within 20 minutes, almost fully erasing the premium over the international price. This likely also caused significant performance differences between the various trend programs.
Can these differences be attributed to (better or worse) judgement? We doubt it. There will surely have been traders who specifically focused on this development, trading CME versus LME copper, either by betting on the full 50 percent premium or by placing the TACO bet.² But these aren’t trades typically placed by trend following programs.
Some managers of trend programs trading CME copper may have realized that their long positions had turned into a binary bet — either 50 percent tariffs would be imposed or they would not — and therefore stopped trading it. If they liquidated their positions after 8 July and before the ultimate proclamation on 30 July, they will have performed admirably.
But we expect that most managers had chosen to trade CME and/or LME copper for reasons unrelated to the only relevant difference in this specific scenario: whether it concerned U.S. copper or international copper. There could have been various sound reasons for choosing one over the other. Some managers may have had a negative experience with the LME or found its 3-month contract structure too cumbersome, and therefore avoided trading LME contracts. Others may have found it operationally more convenient to trade all base metals on one exchange, and thus preferred the broader offering of the LME.
We ourselves must admit that we didn’t fully realize in advance how differently trading CME copper or LME copper could turn out. DTP’s largest long positions in copper were in U.S. copper, primarily resulting from longs against the Japanese yen. This has a history. As we explain in our June 2025 article, “Commodity futures as global benchmarks,” in the early nineties, a significant portion of DTP’s risk was allocated to Japanese commodity futures. These were traded in Japanese yen. When trading activity shifted to U.S. futures, we realized that an unintended consequence would be an increased sensitivity of the program to U.S. dollar moves. We considered this to be undesirable. To mitigate this, we began trading non-Japanese commodities against the yen (we call such combinations of markets ‘synthetic’ markets). One of these commodities was copper. And for convenience, we chose to use the standard U.S. copper contract. Many years later, this decision partly explains DTP’s outperformance on 8 July and its underperformance on 31 July.
By now, it’s clear that trading U.S. commodities synthetically against currencies other than the U.S. dollar is no longer sufficient to limit unintended U.S. policy risks. If we want to make the program less sensitive to erratic U.S. policies, we should reduce our exposure to U.S. markets. This may include U.S. commodity futures. However, as explained in “Commodity futures as global benchmarks,” not all U.S. commodity futures are equal in this respect. Exceptions include ‘New York’ coffee and ‘New York’ sugar, as these effectively do not reflect U.S. prices. Such details have suddenly become relevant, certainly making it an interesting time to be active in the markets.
We wouldn’t say that the extreme price moves we witnessed in U.S. copper in July are economically healthy — let’s be clear: they are not. However, now that many extreme moves have become much more local moves, our diversified approach finds itself in more benign territory. Essentially, such moves contribute to both volatility and diversification, which happen to be the two main drivers of our approach. So far in August, this was reflected in a strong performance for DTP, including some days with returns significantly different from other, comparable trend programs. Again, these differences occurred despite being positioned in largely the same trends, which leaves the size of the various positions and the specific markets in which positions were held as main differentiators. Every now and then, long copper and long copper will turn out to be different positions. Also when it doesn’t concern copper.
¹ In our May 2023 Research Note, “Trading in fast-moving markets,” available upon request, we also highlighted this principle of preserving portfolio diversification following broad, fierce market moves. We provided two additional examples: February 2022, when the Russian invasion of Ukraine shook the markets, and March 2023, when an ongoing U.S. bond yield inversion trend escalated into a banking crisis.
² A TACO trade is a popular strategy among certain discretionary traders. This strategy seeks to take advantage of the tendency for markets that are disrupted by Trump’s messages to reverse when the President ultimately does not follow through on his threats. For example, selling U.S. copper in a spread against international copper after 8 July would ultimately have been a profitable TACO trade. Keep in mind that, also in this respect, past performance is not necessarily indicative of future results.