Our 2013 analysis of the market behavior prior to and after 2008 − what changed and how should we adapt?
July 2013 ●
17 min read
Harold de Boer
Managing Director / Head of R&D
Share
Many trend following strategies, including our Diversified Trend Program (DTP), experienced a difficult five-year period immediately after 2008, with performance significantly below long-term averages. Which at the time raised the question: “Has market behavior changed – and if so, will this change be temporary or structural?”
The following text is an excerpt from ourJuly 2013 newsletter, in which we presented our analysis of market behavior prior to and after 2008. We first explained why DTP was able to perform so well in the years up to 2008. Which basic principles and market behavior were key to this good performance? Next, we analyzed how markets behaved differently post-2008. Subsequently we asked ourselves whether this deviating behavior would be temporary or perhaps structural – and if structural, how we should adapt our way of trading.
Trends, in particular those that are most profitable for trend following systems like those in DTP, are comparable in a number of ways to burning haystacks. Once such a fire has broken out, it is often hard to extinguish. The same applies to price trends. But equally important, a haystack normally does not start to burn all of a sudden. The fire is typically preceded by so-called self-heating − a fermentation process whereby the temperature gradually rises, starting at the core of the haystack. Eventually leading to spontaneous combustion.
In markets, this self-heating − the gradual start of price increases or decreases − is usually the result of the behavior of well-informed market participants who are really on top of the relevant market and as a result signal potential important developments or threats early on and act accordingly (so-called insiders).¹ For example by buying or selling earlier or more than usual. But also by buying or selling later or less than usual. We are referring here to market specific developments. The haystack does not burst into flames due to self-heating somewhere else − at least not immediately.
Trend following systems like those in DTP anticipate that self-heating often leads to fire. They continuously measure the temperature in many haystacks. When they detect self-heating, they will position themselves in that haystack. If the self-heating indeed leads to fire, they profit. If the self-heating instead dies out, they leave the haystack and suffer a (usually limited) loss.
Trends are comparable in a number of ways to burning haystacks
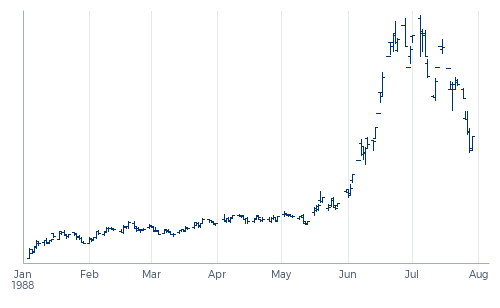
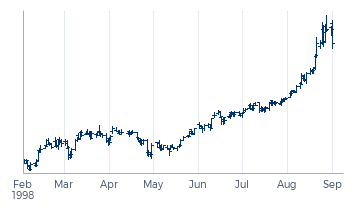
To illustrate this principle we refer to Graph 1, which shows the price development of the Dec ’88 futures contract for Chicago corn. Its price rose sharply in the month of June as a result of drought in the most important growing areas. The saying among American farmers “Rain makes grain” makes it pretty clear that rainfall is an important market specific factor for corn. Especially in the month of June the rapidly growing corn needs an increasing amount of water. But of course this water did not all have to fall out of the sky in June. With a decent amount of rainfall in May there would have been a significant buffer of water in the ground. The lack of the formation of a buffer in May made corn more vulnerable to drought in June. Well-informed corn traders were aware of this and acted accordingly, resulting in a gradual increase of prices, already in May. In a well-functioning corn market, an imminent drought is thus already observable in the prices before it is actually observable in the crops on the field. This is the self-heating. In the summer of 1988 Transtrend only existed as a research project, but with the trend following systems that we have used since we almost certainly would have picked up this self-heating, resulting in profits during the fire in June.
Graph 1 – Effect of drought in 1988 on the price of the Dec ’88 contract for Chicago corn (‘self-heating’ followed by ‘fire’)
Of course not all important price trends are preceded by self-heating. They can also appear suddenly. To stay with our metaphor: the haystack can also catch fire by a lightning strike. Still, trend following strategies seem much less vulnerable to these types of unexpected external factors than is often feared. There are a couple of reasons for this. The first one: even if a lightning strike itself is unpredictable, this doesn’t mean that its impact is unpredictable too. The hay barn with a badly wired electrical system will catch fire; the other one will merely suffer a few blown out fuses. This vulnerability too is often already present in the market and observable in its price pattern.
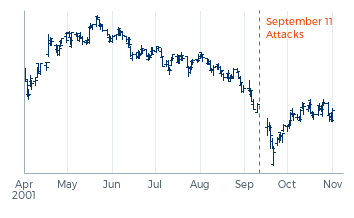
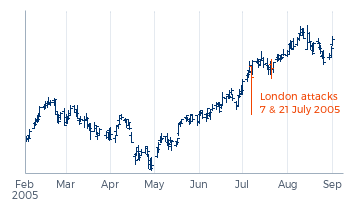
Graphs 2 and 3 illustrate this principle: they show the impact of the terrorist attacks in September 2001 on the U.S. stock market and that of the terrorist attacks on 7 and 21 July 2005 in London on the U.K. stock market. At the time of the attacks, the U.S. stock market was already weak because of a market specific factor: the deflating internet bubble. The attacks caused a temporary acceleration of that decline. The London attacks, on the other hand, hit an intrinsically strong stock market. Especially the first of the London attacks resulted in a short and sharp reaction, but the next day ‘the fuses had already been replaced’. Put differently: the attacks in the U.S. threw oil on the fire, those in London oil on the road. In the first case a trend following strategy benefits; in the second case the only risk is that a trend following strategy loses control and slips, for example by using so-called protective stops.
Graph 2 – Market impact of the terrorist attacks in September 2001 on U.S. stocks (‘oil on the fire’)
Graph 3 – Market impact of the terrorist attacks in July 2005 on UK stocks (‘oil on the road’)
These two different market reactions to terrorist attacks are typical for how markets in general often respond to lightning strikes. And also to other unpredictable forces of nature, such as earthquakes, volcanic eruptions and hurricanes. They are often accompanied by short and wild movements − sometimes in the form of an acceleration, sometimes in the form of a reaction − but they seldom lead to a reversal in a longer term trend.
And even if such a lightning strike does turn out badly for part of the portfolio, there is a second reason why the overall portfolio is often vulnerable only to a limited extent: in a well-diversified portfolio the same strike of lightning can have a different impact on different trends (driven by different market specific factors). Losses on the negatively affected part of the portfolio are then − partially or completely − compensated for by gains from the oil-on-the-fire trends.
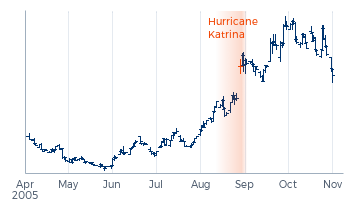
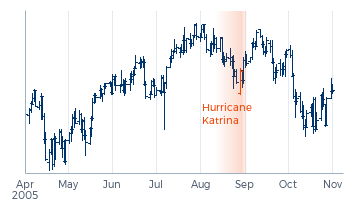
Graphs 4 and 5 illustrate this. The market impact of hurricane Katrina in August 2005 resulted in such a massive acceleration of rising natural gas prices that within DTP, losses on long positions in stock markets − whether hurricane-related or not − were largely compensated for by gains on long natural gas positions.
Graph 4 – Market impact of hurricane Katrina in August 2005 on gas prices (profits from ‘oil on the fire’)
Graph 5 – Market impact of hurricane Katrina in August 2005 on U.S. stocks (losses due to further weakness)
We have now expanded our haystack metaphor to a broader model with multiple haystacks. Each haystack can, completely independently from the others, burst into flames because of self-heating. These are different trends driven by different market specific factors. Furthermore, they can all − often in the same thunderstorm − be struck by lightning, to which some are then more sensitive than others. But it is also possible for the fire to spread from one haystack to the other. The following example illustrates this mechanism.
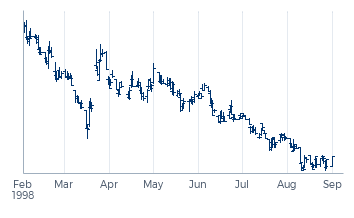
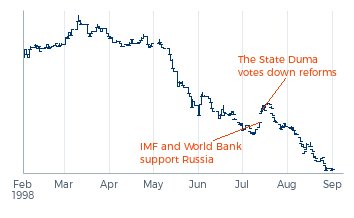
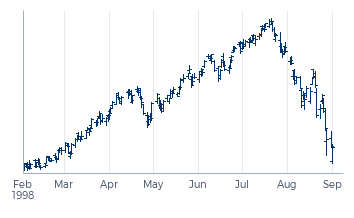
The period leading up to the Russian financial crisis in the summer of 1998 was in itself a chain of self-heating haystacks and spreading fires. And comparing the Russian economy in those days to a hay barn, not only the electric wiring was faulty. The major dependency on the export of oil and gas made it extremely vulnerable to the price of oil. And precisely the price of oil experienced a major downtrend from the Asian crisis in 1997 onwards, quickly dragging the Russian economy with it. On 13 July 1998 Russia made a deal with the IMF and the World Bank. Russia was allowed to borrow billions of dollars, but in exchange had to implement a number of reforms. When these reforms were voted down by the State Duma, the Russian crisis reached its climax. The fire flared up and spread abruptly to, for example, the stock markets outside of Russia, including that of Germany. Graphs 6, 7 and 8 show this spreading fire.
Graph 6 – Downtrend in the price of oil prior to the Russian crisis in the summer of 1998
Graph 7 – Downtrend in the Russian equity market during the Russian crisis
Graph 8 – Market impact of the Russian crisis on German equities (reversal caused by 'spreading fire')
Graph 9 – Market impact of the Russian crisis on German bonds (acceleration caused by 'oil on the fire')
In order to function well, a diversified trend following strategy has to be able to timely detect local self-heating in sufficient different haystacks, allowing for adequate positioning in the major fires before they flare up and spread.
Such a sudden reversal as the one seen in stock markets in July 1998 is one of the most unfavorable market movements for a trend following strategy. DTP was also affected. But the total loss remained limited in July 1998, mostly as a result of profits on short positions in oil and gas. In essence, these were positions in the burning haystack from which the fire spread; positions in the haystack where the self-heating started and was detected.
The further spreading of this fire suited a diversified trend following strategy particularly well. The further decline in stock markets acted as oil on the fire for the already rising bond markets, as illustrated in Graph 9. August 1998 is still the best month in DTP’s history. Gains on long positions in bond markets and short positions in commodities such as oil and gas were the main contributors. But although virtually all markets that month were gripped by the Russian crisis, one can hardly attribute DTP’s result in that month to a good response to that crisis. The trend following systems in DTP had already detected self-heating in various different places. A few of those − the decline of oil and gas − eventually flared up and became spreading fires. While other, in itself unrelated ones eventually flared up due to oil on the fire.
This brings us to the ideal market behavior for a diversified trend following strategy. In order to function well, such a strategy has to be able to timely detect local self-heating in a sufficient number of different haystacks, allowing for adequate positioning in the major fires before they flare up and spread. And it seems that in the last few years markets have offered such conditions to a much lesser extent. Which raises the question: “Has market behavior changed – and if so, will this change be temporary or perhaps structural?”
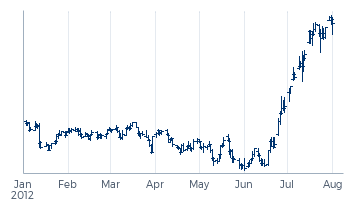
We start our analysis of market behavior over the past few years by looking at Chicago corn again. Graph 10 shows the market movement during the 2012 growing season. Just like in 1988 the most important growing area for U.S. corn was plagued by drought. Again the price rallied significantly as a result. This time, however, DTP was not able to profit from the trend. In our July 2012 market report we referred to this as “a price movement of a nature for which the systems in DTP are not typically designed to capitalize on en masse”. Comparing the graphs of corn prices of 1988 and 2012 reveals the key difference: in 2012 the self-heating phase is absent. Where the price in 1988 was already gradually rising before the growing crop actually needed the water badly, in 2012 the market only responded when the damage from the drought really could no longer be denied.
Graph 10 – Effect of drought in 2012 on the price of the Dec ’12 contract for Chicago corn (absence of ‘self-heating’ before the ‘fire’)
Graph 1 – Effect of drought in 1988 on the price of the Dec ’88 contract for Chicago corn (‘self-heating’ followed by ‘fire’)
We have since done further research into this specific situation. What has changed in the 24 years in between? One element that seems to have played a role is the rise of genetically modified corn species which are supposed to be less sensitive to drought. Possibly this led some market participants to be less wary of drought. Nonetheless, in the spring of 2012 there were various insiders who did correctly assess the vulnerability of the crops and acted accordingly. These participants themselves also have expressed how amazed they were that the corn price would nevertheless not rise. A number of them were not only amazed, but also concerned; as long as corn prices kept falling, they had to post additional margin for their established long positions. Why did the corn price fall while insiders were buying?
An important possible explanation lies in the market impact of market participants who are not acting based on market specific factors. Relevant for corn is the surge of market participants who invest in commodity indices. They buy or sell a complete basket of commodities based on their changing expectations about a more global factor, for example inflation. Corn is a component of many of these commodity indices. And considering the movement of for example the popular Goldman Sachs Commodity Index, as shown in Graph 11, it seems plausible that such participants were mainly reducing their positions in the spring of 2012. The capital that is pumped through the commodity markets via such indices has increased significantly in recent years. It is therefore not strange to assume that such capital flows based on global factors can smother the price impact of market specific factors. Until such a market specific factor can truly no longer be ignored, causing the haystack to suddenly burst into flames without observable self-heating.
Graph 11 – Strong downtrend in the GSCI prior to the drought of 2012
This is not an isolated incident. And the phenomenon is certainly not limited to the commodity markets. While looking back on the Greek crisis the current president of the Dutch central bank, Mr. Klaas Knot, noted that the financial markets had not functioned properly in the pre-crisis period. In his opinion, the interest rates on Greek government debt should have risen a lot sooner. The discipline of a well-functioning market would not have allowed the Greek debt to rise to such problematic levels. And looking back at the development of Greek interest rates, it seems that until November 2009 the market had generously interpreted the Greek expenditure book as a fertile cornfield so perfectly modified that there could not be any cause for concern.
To explain this we will have to look at the driving factors behind the capital flows to Greece. Undoubtedly there will have been participants who invested in Greek government debt based on a (with hindsight unfavorable) calculated trade-off between return and country specific risk. But a significant portion seems to have flown to Greek treasuries by allocations (according) to European bond indices. And for such capitalization-weighted indices the following applies: the greater the debt of a country, the more capital the investor allocates to it. Exactly the opposite of what a rational insider would do. And so also here the self-heating remained subdued until it was impossible to extinguish the fire.
In recent years we have seen many managed futures-related comments about increased correlations. And indeed, it does seem that post-2008 we have experienced a very limited number of often overly globalized factors, which dominate price movements on the most diverse markets for extensive periods of time, thereby smothering the impact of market specific factors completely, until such a market specific factor cannot be ignored any longer, upon which it flares up abruptly, sometimes then immediately becoming the next overly globalized dominating factor. One moment no one looks at Greece − the next moment the entire world only looks at Greece.
Which factor dominates is different every time. In the summer of 2011, political developments in Italy caused shockwaves around the world; in 2013, impossible election results in the same Italy hardly had any impact anywhere. By then the markets were dominated by QE. Or more precisely: by then the markets let themselves be dominated by QE. Because one can hardly blame a central bank for the fact that so many market participants find its policy such an overwhelmingly important driver of their actions. Just like one cannot blame Greece for temporarily turning the world upside down with its tiny economy. The world let itself be turned upside down.
It does seem that post-2008 we have experienced a very limited number of often overly globalized factors, which dominate price movements on the most diverse markets for extensive periods of time, thereby smothering the impact of market specific factors completely.
This phenomenon of exaggerated herding behavior is a sign of the times. The hype of hypes. And the index-tracking we criticized above is only one of many ways along which this phenomenon can find its disturbing way to the markets. Please note that we cannot and do not wish to use this phenomenon as an excuse for our disappointing results in recent years. As long as there have been markets, there have also been participants who disturb them. More often unintentionally than intentionally. It is up to the other market participants not to be thrown off course by this, or rather, to profit from it − acting as a correcting force in the process. We certainly view this as our duty and challenge as responsible investors; more about this later on. First we will explain why this phenomenon has not worked in DTP’s favor.
The first direct adverse effect of this phenomenon for DTP should be clear from our analysis of the price movement of corn in 2012. When a market specific factor, which eventually leads to a major trend, does not manifest itself through the presence and actions of insiders in self-heating, a trend following system will not be able to benefit from it, or at best to a much more limited extent. In our metaphor we are then still dealing with multiple haystacks, but with only a limited number with potential, timely observable self-heating. In such a combustion, it is highly likely that many haystacks will catch fire simultaneously. Most of them without self-heating.
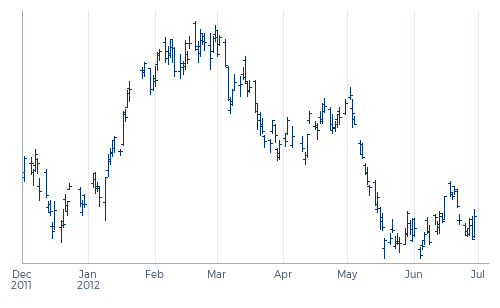
When only a limited number of haystacks exhibit self-heating, DTP normally still picks this up. The program could of course try to position itself heavily in these haystacks to profit nicely when the self-heating leads to a massive spontaneous combustion. Something like this happened in May 2012, when the wave of gloom about economic growth in China − preceded very nicely by Chinese self-heating which the program already detected in the course of March − reached its climax, as illustrated in Graph 12. This indeed resulted in a very nice month for DTP. Some caution is required here, however. The disadvantage of such a ‘one-factor fire’ is not only that it catches everywhere at virtually the same time, but that such a trend will reverse everywhere almost simultaneously as well. Which is what promptly happened in June 2012.
Graph 12 – Gloom regarding the economic growth in China with a climax in May 2012 (‘self-heating’ followed by (massive) ‘fire’)
Another example of such major trend clustering is formed by the many trends in the first half of 2013 driven by QE: rising bond prices, rising stock prices, rising carry-trades and rising oil prices. DTP’s systems picked these up reasonably well. But because it was predictable that these trends would also at some point reverse virtually simultaneously (just not at which point), and we always wish to limit the loss resulting from one single clustered trend reversal, the total participation in this single trend was automatically limited. The result was that DTP’s losses resulting from the QE-trend reversal in May-June were indeed nicely limited. But the price paid was that the total earlier gains from the QE-trend also remained limited.
DTP performs best when it can act in multiple but different self-heating haystacks at the same time. Even though all these different sources of self-heating may eventually culminate into one big conflagration, such as during the Russian crisis or, fueled by deflating bubbles, as seen in 2002 and 2007-2008.
Self-heating again
So what comes next? Is the hype of hypes indeed only a hype? Or will it prove to be a structural change of market behavior? We are inclined to believe the former, as we trust in the power of common sense. We do not believe that rational investors will continue to allocate to commodities without having someone check whether the status of the corn fields is indeed comparable to that of the oil supplies. Just like we do not wish to believe that rational investors will continue to invest in emerging markets without having someone check whether the conditions in Brazil, Nigeria, Turkey, Thailand or South-Korea actually are comparable.
And if naïve ‘outsiders’ will continue to pump around large flows of capital, thereby overwhelming all market specific factors, then this will normally offer perfect opportunities for (new) insiders. No, we do not intend to stick our fingers deep into cornfields to detect signs of drought − that is not our area of expertise. But we expect other, specialized market participants to start doing so more often again. That they create self-heating again. We have already observed a few signs of this. Actually already since October 2011 we have signaled somewhat decreasing correlations. And although this spring the corn market let itself be completely surprised again − this time by a crop report, we noticed neatly diverging price movements in the wheat and soy markets. Just as one would expect in a delayed spring in the U.S. So yes, the healthy self-heating seems to be returning here and there. Starting where the market specific factors are the hardest to ignore for a prolonged period of time.
But tending to trust in the power of common sense does not mean that we will bet the house on this. The acknowledgement of the fact that many participants are not always acting rationally is in fact the basis for most successful investment strategies. In any case we will not say: “The difficulties were caused by QE; QE is nearly gone and then our programs will perform again”. If only because − as we have explained above − QE itself was not the problem. The problem was that the entire market was so focused only on QE. But if that same market from now on would start to focus just as exclusively on another factor, even if that factor is the number of sunspots, then nothing really changes. And we do not want to exclude the possibility that this, at least to some extent, may last a while longer.
Picking up more self-heating
How to proceed then? We think we can better align our programs with current market conditions by detecting the self-heating that is still present even better and in more different places, and by taking advantage of it more effectively. This effort consists of four components:
Improving the detection of self-heating: Creating more robust and more different trend-identification systems, combined with a better interaction between these systems, based on these differences. With regard to robustness we are aiming for systems that are more robust for violent short term price reactions without making the systems slower.
Tracking down self-heating in more different places: Adding more (different) markets − both outright and synthetic market combinations − to our programs, thereby shifting our focus from "the number of markets" to the ultimate target, "the number of different trends".
Being able to better exploit this self-heating: Ensuring that we can trade markets sufficiently large, i.e. increasing capacity, specifically in the most divergent markets, which among others includes ensuring (better) access to more, different liquidity pools.
Actually exploiting this large(r) capacity in places where self-heating is detected: This requires some fundamental changes to the money-management layer of our programs, among others by creating more and better correlation measures and by applying these measures differently, under the unchanged condition that the total risk concentration may never become irresponsibly high.
This is the main focus of our research. In principle, developments in this direction are not only favorable when the recent market behavior continues, but also when the old days of abundant self-heating will return again. Because we do not want to throw out the baby with the bathwater.
Source of all data used in the graphs in this article: Thomson Reuters, Bloomberg and Transtrend.
¹ This concerns the phenomenon of ‘diffusion of inside information’. An example of such an insider is a farmer who decides to sell corn futures when he sees that his corn crop is maturing well. Or a farmer who decides to buy corn futures when he sees that his own corn crop is not maturing well enough to feed his cattle. Please note: we are definitely not speaking of market participants who would trade based on inside information which they are not allowed to trade upon.
We use cookies to ensure that you enjoy the best experience on our website. We do not use any third party cookies.
Our website may, however, include hyperlinks to external websites that use third party cookies.
For further information, please read our
Privacy statement
and
Terms of use.