- After many years of low/declining interest rates and minimal inflation, trading strategies are prone to be biased towards such a regime.
- Awareness of this pitfall is the first step in getting prepared for a regime change.
- The challenge is to look forward, rather than back.
Two trending topics in the investment community in the past month or so are the rotation trade and reflation. The rotation trade started within the equities space and refers to investors reducing their positions in sectors they fear might have risen too much in the Covid-19 recovery trend which started in the last week of March ’20, such as stay-at-home tech stocks, and reallocating their capital to sectors they expect to recover strongly once more people are vaccinated, such as the travel industry. Reflation refers to a situation where economic growth and inflation are both accelerating. It typically follows a recession, and typically includes rising prices of commodities as well as rising stocks.
The current reflation regime emerged last autumn after optimism about the forthcoming vaccination programs. In itself, rising commodities and stocks don’t really hurt most investment portfolios. However, some investors and policy makers fear that the current reflation might mutate into ‘just’ inflation, which potentially includes significantly rising interest rates. And that would be a regime not necessarily beneficial for investment portfolios. Certainly not for the investments that benefited the most from the low/declining interest rates during the past few decades. And, connected to that, probably also not for some of the investments that benefited the most from the massive global government support in response to the Covid-19 pandemic. Which is where the rotation trade and inflation fears overlap.
Could investment portfolios have become explicitly or implicitly biased towards low/declining interest rates and towards no/low inflation?
We would no doubt have great commercial success if we could offer a trading program that has empirically shown its effectiveness during periods of rising rates/high inflation in recent years. The problem is, such a program cannot exist, for the simple reason that we haven’t seen strongly rising interest rates nor significant inflation for many years now. At least, not in the economies where our program is predominantly active. This cold reality raises the question: Could investment portfolios have become explicitly or implicitly biased towards low/declining interest rates and towards no/low inflation? As an investment manager we may have allowed such biases to creep into our own program. And allocators may have incurred such biases by predominantly allocating to biased trading programs.
Looking back
There are different ways such a bias can creep into a strategy. Their common denominator is they look back. Whether we generate ideas based on what we’ve (recently) seen and experienced or explicitly run historical optimizations, whether we use robust hypothesis testing techniques or apply advanced machine learning techniques, whether we use only price data or use alternative data as well, in all cases it’s the past that guides our decisions. For a trend strategy like our own Diversified Trend Program (DTP), such a bias could enter the program along three main routes:
- The selected market universe. The best tradable trends in an inflationary scenario don’t necessarily manifest themselves in the same markets as in a non-inflationary environment. For instance, in the past decade or so (though not this year so far), commodity markets generally weren’t showing the best trends. Managed futures programs trading less in commodities tended to outperform programs trading more in commodities during this period. Will that be the same in an inflationary scenario?
- The applied trend indicators. The trend indicators performing best in an inflationary scenario aren’t necessarily the same trend indicators as the ones that performed best in the recent non-inflationary environment. For instance, most markets typically don’t move in a symmetrical way — uptrends in commodities and downtrends in bonds, which seem to be most promising in an inflationary scenario, aren’t necessarily comparable to downtrends in commodities and uptrends in bonds.
- The risk allocation across the different markets. The largest differentiator between different trend strategies is not which trends are traded in which markets, but the sizing of the various positions in these trends. Whether done more explicitly through historical optimization or through a portfolio risk approach using correlations, the outcome will inevitably be colored by history. Will correlations between markets be the same in an inflationary scenario as in a non-inflationary scenario? That doesn’t seem very likely.
The correlation issue is the hardest nut to crack when trying to successfully navigate regime shifts.
In our experience, solving the correlation issue is the hardest nut to crack when trying to successfully navigate regime shifts. Solely relying on data, often embraced as the holy grail of quantitative finance, almost certainly leads to a suboptimal solution. The following risk statistics of DTP, related to its actual positions in interest rate instruments, may serve as in illustration.
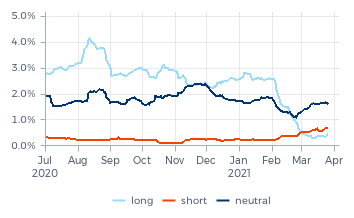
The chart below on the left shows the undiversified risk within the interest rate cluster, split up in long positions, short positions and ‘neutral positions’ (synthetic spreads between different futures contracts, such as long German bonds versus short U.S. bonds). It shows that until the first week of February, DTP was sizably net long. Only since the first week of March did the undiversified risk in short positions outsize the risk in long positions. But still not really a sizable net short position. This might seem somewhat odd and undesirable given the strong downtrend in at least the U.S. bonds so far this year, as illustrated by the chart on the right. Did some form of bias prevent the program from entering into more sizable short bond positions?
Aggr. directional risk in interest rate instr.
Trend risk around U.S. 30-yr T-Bond
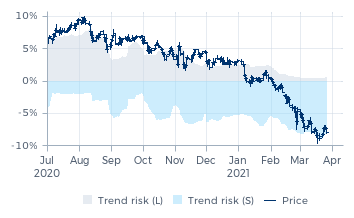
The chart on the right doesn’t only show prices, but also the (diversified) trend risk around long U.S bond positions (the grey area) as well as around shorts (the blue area). In contrast to the undiversified risk statistics, this graph shows that DTP does currently hold a sizable short position in and around U.S. bonds. The difference between the two statistics is made up by the ‘and around’ part — positions in markets correlated with short U.S. bonds. In fact, DTP’s risk measures have restricted the size of the short positions in U.S. bonds in order to prevent the trend risk around these shorts from growing too large.
This illustrates the importance of correlations. Without these highly correlated positions, the program’s short positions in bonds could and should be much larger. So if we for instance believe our correlation measures are overestimating actual correlations because of outdated data not representative of the current regime, the short positions in bonds should be larger. It’s our job to make this call.
To be honest, we do believe that some of these measured correlations are outdated, as we know their history. A part of DTP’s position in the reflation trend are long positions in stocks. As recent history was dominated by risk on/off dynamics, falling stocks were typically accompanied by rising (safe haven) bonds. This explains why correlation measures treat short bonds and long stocks as additive risks. But is this still relevant in the current environment? Inflation fears introduced the inverse dynamic: rising yields (i.e. declining bonds) now trigger declining stocks. As is always the case with correlation measures, it will take some time before the measures will fully capture that.
But for the largest part of the relevant positions the program holds, it doesn’t seem that the applied correlations are inflated. Already since before the start of the current reflation regime, DTP’s largest positions have been longs in commodities (which contributed significantly to DTP’s healthy start to 2021). And due to their growing correlation, these positions increasingly add to the risk around short U.S. bonds as well. If reflation will really change into inflation, longs in commodities and shorts in bonds can still be regarded as positions in the same trend — long commodities and short bonds are two of the most popular positions for investors who fear inflation.
Looking forward
Which brings us to the macro component in DTP. With our program we strive to be sizably invested in different trends. In the past, adding as many markets as possible — including synthetic markets — to the program’s market universe did the trick; the trend indicators would then effectively pick up the trends in these various markets the moment they manifested themselves. However, due to changed market dynamics, the correlation structure between markets changed in such a way that this mechanism gradually lost its effectiveness. Trends were still picked up, but it took the program longer to get sizably invested in a broader trend. Which led to the somewhat paradoxical conclusion: in order to get sizably invested in different trends (again), we needed to be more restrictive in the selection of traded markets.
In order to get sizably invested in different trends, we need to be somewhat restrictive in the selection of traded markets.
But how to make that selection? The typical quant approach would be: let history decide. We could for instance backtest which markets historically have manifested the best tradable trends. But that would be the kind of historical optimization that we — among others for the reasons mentioned earlier — have always shied away from. Instead, we opted for a more forward looking approach. As part of our research we identify and discuss the major themes that could potentially drive markets in the foreseeable future. We discuss which price trends in which markets (including synthetic markets) such a theme could trigger. Subsequently, we make sure that DTP will be able to get sizable positioned in these markets. In essence, this resembles a macro or thematic style of investing. The important difference is: we don’t strive to predict when these trends will start. We don’t even know for sure whether or not these trends will occur, and if they do, whether or not they will occur in the anticipated markets. We leave that part to the applied trend indicators.
Among the recent themes that helped shape DTP’s horizon of traded markets are Brexit, the U.S. elections, the energy transition and of course inflation. With regard to inflation, we seemed to have been somewhat too early. For a few years already, we’ve included various synthetic markets specifically developed to trade some typical inflation trends. The leading idea was that the program should be able to profit well from rising commodities in such an environment. The fact that the commodity futures that can be traded the largest are mostly denominated in U.S. dollars received our special attention.
Again, we don’t strive to predict how much further yields will rise, and whether or not we are entering a period with persistent inflation. We know our limitations when it comes to predicting. However, what we’ve been working on and what we’ll continue to work on, is to make sure that DTP will be able to perform well also in the potential scenarios where yields do continue to rise and/or inflation does persist. DTP’s healthy start to 2021 encourages us to continue further along this path.
Explanatory notes & important information
Synthetic markets
Synthetic markets are combinations of outright markets, such as spreads.
Trend risk
Trend risk is defined as the estimated aggregate impact of a major adverse price move in a particular market and the coinciding adverse price effects in all markets currently exhibiting the same trend. Trend risk can be displayed on a portfolio level, a trend level, as well as around an individual market.
Which positions add up to all of the program's risk concentrations will change from day to day. Risk metrics are not static metrics — throughout the years the definition and the way the program utilizes these metrics have been (materially) changed, see for example our February 2019 and July 2019 Monthly Reports. Risk numbers therefore cannot always be compared over time.
Aggregate directional risk within a cluster
Within a cluster, positions can be long, short or neutral. Within the interest rates cluster, for instance, we can have long positions in interest rate instruments, short positions in interest rate instruments and neutral positions, resulting from explicit interest rate spreads. The aggregate directional risk within a cluster represents the sum of the risk in all individual positions, per side, within that cluster, irrespective of their correlations, and irrespective of associated risk in positions in other clusters.
All risk figures presented in this report are indicative for the Enhanced Risk (USD) profile of DTP.
Source of price data used in this report: Refinitiv, Bloomberg and Transtrend.
THE VALUE OF YOUR INVESTMENT CAN FLUCTUATE. PAST PERFORMANCE IS NOT NECESSARILY INDICATIVE OF FUTURE RESULTS.