- In order to withstand large short-term uninformed price moves, a trend following strategy has to be robust, not necessarily slow.
- Slow systems tend to become impassive for a while after a period with higher volatility. This typically slows down their drawdown recovery.
Trend following CTA programs have not been able to generate a positive return in the first half of 2018. An article in Institutional Investor¹ explains why: “Commodity trading advisers haven’t protected investors during market downturns this year because they aren't sticking to their principles. They were hard hit when equity markets went down in early February, and in May, when Italy’s political crisis infected markets around the world, CTAs bombed. CTAs have adapted their trading techniques to be more profitable in the recent market environment and as a result they’re less capable of hedging equity corrections. Among other moves for the current environment, many CTAs have changed their time frames to sell when markets turn down. It used to be as the markets went down, CTAs would sell quickly. CTAs are now waiting for a two-month correction, say, instead of a two-week downturn before they start selling.” This is referred to as a worrying type of style drift.
The criticism that trend following CTAs have lengthened their time frames isn’t new. Neither is the notion that this style drift could undermine their ability to protect investors during stock market downturns. We recognize some truth in this criticism. However, such style drift does not explain the losses of trend following CTA programs in early February. The sharp sell-off in the U.S. equity markets in the evening of 5 February happened only a week after the morning of 29 January when the S&P 500 index set new highs in its uptrend that had been running since the second half of August 2017.²
Graph 1 – Sell-off in E-mini S&P 500 on 5 February 2018
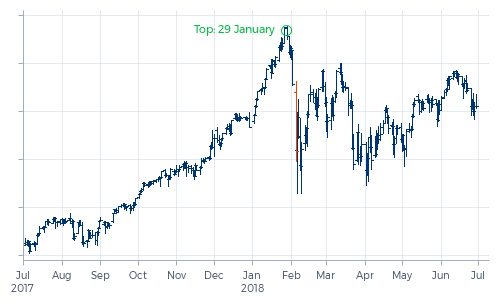
In such a sharp market reaction, it doesn’t matter whether a program sells after a two-month correction or after a two-week correction — in both cases the program will lose. In fact, if our Diversified Trend Program (DTP) had profited from this downturn in equity markets in early February, we would have expected our investors to wonder whether we were guilty of style drift. Only really short term programs can potentially profit from such short-term market corrections. One could talk at some length about the magnitude of the losses that DTP sustained in this market reaction, but the occurrence of this kind of losses is not up for debate.
To a large extent the criticism on the slowdown of trend following CTAs seems to be founded on the analysis of CTA indices such as the Barclay BTOP50 index and the SG Trend Index. It is important to realize that the composition of these indices changes over time. For instance, out of the ten programs that comprised the SG Trend Index at the start of 2018, four were not offered before 2009. In fact, three of the managers concerned did not offer any trend following program back then. We believe the emergence of new CTA programs should not be confused with style drift.
So if CTA indices indeed have become slower after 2008, then that doesn’t necessarily imply that the individual CTA programs have become slower. Given that the composition of these indices is to a large extent determined by assets under management, in essence it could just mean that CTA allocators have allocated relatively more funds to slower CTA programs. And it is not so hard to understand why CTA allocators would have decided to do so: slower CTA programs tended to perform better in the years after 2008 than faster programs.
Over time, we observed this emergent advantage of slowness too. Market dynamics have changed since 2008. One of these changes concerns the growing magnitude of short-term uninformed price moves. This directly undermines the profitability of a trend following approach. Slower systems are by definition less sensitive to, and therefore less vulnerable to, large short-term price moves. This in itself would have been a strong argument for us to adopt slower systems, if such a change had not come with a major disadvantage. Slowing down our program would undermine DTP’s ability to perform well in equity market downturns. Rather than making our systems slower, we therefore chose other techniques to make our program more robust. Meaning: less sensitive to short-term uninformed large price moves, while preserving, or even improving, the ability to respond fast to actually changing underlying trends.
Slowing down a trend following program undermines its ability to perform well in equity market downturns.
The fierce global equity market reaction in the first week of February was not the kind of market reaction that a medium term trend following strategy can be expected to profit from. But after 2008 we have witnessed two quarters with equity markets declining globally in a way that historically would have been very beneficial for trend following programs.
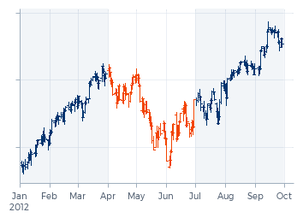
The first one was in the second quarter of 2012. DTP made a mild profit in April, a very good profit in May, but it lost a considerable part of these profits in June. And the program didn’t make new equity highs during this quarter. In fact, this quarter is part of the program’s deepest and longest drawdown. This was not what we expected from our strategy. Maintaining the systems’ speed turned out to be not enough to preserve the program’s ability to profit from such a market environment to the same extent as before. Upon further inspection we learned that the source of this performance degradation was to be found in the changed market dynamics. The negative impact of these changes on DTP was larger and more widespread than we initially expected and realized.
Graph 2 – E-mini S&P 500 in Q2 2012
Graph 3 – E-mini S&P 500 in Q1 2016
We have written about this development and our responses to it in our articles “Hay fires and self-heating” and “Speed skating – volatility versus drawdowns”. The observation inspired us to make a whole series of adjustments to every layer of our program, from data filtering to execution strategies. One of our goals was that, in situations like in the second quarter of 2012, DTP should be more sizably invested already in the early stage of the sell-off, especially close to the ultimate source of the sell-off, so that it would profit more from the early stage of this trend. Robustness, not slowness, is one of the key elements for that.
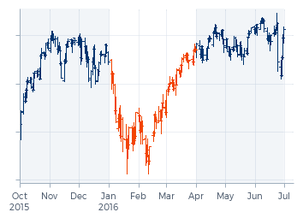
The proof of the pudding is in the eating. The first quarter of 2016 happened to be largely comparable with the second quarter of 2012. Again a large-scale, global market sell-off followed by a recovery. And this time DTP did set new equity highs. As did some other long-running trend following CTAs that had made the reputation of this investment style with their stellar performances in 2008, in 2002 and during other global equity market sell-offs before the turn of the millennium. However, this was not the case for the Barclays BTOP50 Index or for the SG Trend Index. In fact, some of the constituents of these indices are still in their deepest drawdown that started from a peak before 2016. We cannot exclude the possibility that lack of speed is an explanatory factor for that. But there may be other factors, too.
Reverting to the market sell-off in early February. There is another reason for us to avoid slowness. The advantage of slower systems might be that they are less sensitive to short-term large price moves and therefore more stable during short-term periods with excessive volatility. This advantage however immediately becomes a disadvantage when this low sensitivity tilts into insensitivity as a response to the excessive volatility. Slow systems tend to become impassive for a while after a period with higher volatility. That does not hurt as long as the dominant trends continue. But typically after a period of high volatility, fresh trends start to develop, like flowers blossoming in the desert after a thunderstorm. Slow systems are not very effective in picking these flowers.
This second-order difference between faster and slower systems explains the typically wide dispersion in performance among CTAs immediately after a short-lived high volatility period. And this isn’t a new phenomenon. For instance, November 2001 was a very difficult month for most trend following CTA programs back then; and this was followed by a period of huge dispersion. More recently, there was a huge dispersion in performance in the weeks following wild market reactions to the Brexit referendum in June 2016.
Graph 4 – DTP and SG Trend Index from 1 January 2018 through 30 June 2018 (9 Feb = 100)
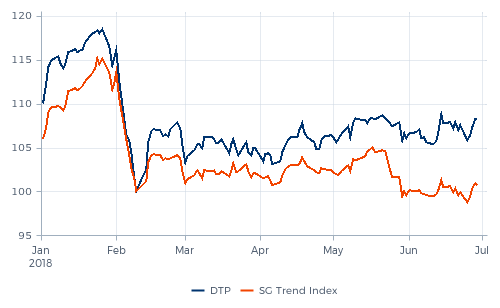
After the volatility in early February, we see the same kind of dispersion. The deepest point of the market reaction was on Friday 9 February. By the end of June, the SG Trend Index had recovered only 0.7%. And not all trend following programs recovered; some even sunk below their deepest point in February. Lack of speed after the February volatility – and again after the Italian volatility in May – is the most likely explanatory factor for that.
By the end of June, DTP had advanced 8.2% from its deepest point in February. That may be better than the average trend-following program in the SG Trend Index, but we don’t consider this to be good enough. A better performance, especially from March through May, should have been expected. Increased robustness remains a key element in further improvements that we are working on. Again, not the kind of robustness that leads to slowness, but the kind of robustness that enhances the program’s ability to be fast.
- Source of all data used in the graphs in this article: Thomson Reuters, Bloomberg, BarclayHedge and Transtrend.
Footnotes
¹ Here’s Why CTA Strategies Are Failing Investors, Institutional Investor, 29 June 2018.
² In this article we use only the E-mini S&P 500 index futures to illustrate periods exhibiting global equity market downturns. In our Diversified Trend Program we trade many more futures. In fact, the downturn of equity markets in the first week of February went accompanied by downturns in commodity markets like oil and an upturn in the U.S. dollar.
All performance data of DTP presented in this article are composite net performance figures of DTP - Enhanced Risk (USD) and should be viewed in conjunction with the explanatory notes, which are an integral part of this performance data.
All SG Trend Index performance data should be viewed in conjunction with the description of indices used.
THE VALUE OF YOUR INVESTMENT CAN FLUCTUATE. PAST PERFORMANCE IS NOT NECESSARILY INDICATIVE OF FUTURE RESULTS.
Back to top