Trendvolgen

Een kwestie van beweeglijkheid

Beleggingen zijn gevoelig voor grote marktbewegingen. De mate en aard van die gevoeligheid wordt bovenal bepaald door keuzes van de belegger.


november 20178 min leestijd

Harold de Boer

Managing Director / Head of R&D

Dit artikel is alleen in het Engels beschikbaar.

  • The extent to which volatility harms or benefits an investment strategy first and foremost depends on the choices made by the investment manager.
  • If we want to profit from volatility, we should not shy away from the volatility offered to us by the market.
  • During the first nine months of 2017, equity markets offered enough volatility to profit from with a trend following strategy in those markets.

Een kwestie van beweeglijkheid (2017)

Download PDF

A popular explanation for the lackluster returns of trend following strategies during the first part of 2017 is “lack of volatility”. Although we do recognize some truth in that, we cannot really embrace the statement. Especially not when it is used with a reference to stock markets. We would even state: if the volatility in interest rate, currency and commodity markets would have been as high as the volatility in stock markets, trend following strategies should have enjoyed a very profitable first nine months of 2017.

Problem is, there is no such thing as ‘the volatility’. Volatility manifests itself in many shapes and forms. And it can be measured in many ways. Not every type of volatility is necessarily good or bad for a trend following strategy. Or for any other investment style. We would argue that the extent to which ‘volatility’ harms or benefits an investment program depends more on choices made by the investment manager, rather than on the specific investment style. And therefore, “lack of volatility” is not an adequate excuse for disappointing performance.

There is no such thing as ‘the volatility’. Volatility manifests itself in many shapes and forms.

Let’s start with a hypothetical example. Suppose all markets rise 0.1% every business day. In financial-academic terms, this represents zero volatility. It would be a traditional investors’ paradise. Without leverage and without risk, 250 of these business days add up to 25% return in a year. Even more if we include compounding.

The same applies to a trend following strategy. And for this investment strategy, a 0.1% decline every business day would be just as good. In such scenarios, no trend follower would complain about “lack of volatility”! Of course, these hypothetical examples are far from realistic. But they perfectly illustrate that “lack of volatility” in itself does not explain lack of performance of a trend following strategy.

Let’s now look at a real-life manifestation of market volatility: the flash crash in U.S. stock markets on 6 May 2010. The S&P 500 declined around 10% within 20 minutes, only to recover from that the same day. Such a price move represents enormous volatility. However, if you measure volatility the traditional way, only taking into account end-of-day prices, you will not notice it.

Graph 1: Flash crash in the S&P 500 Index on 6 May 2010

volat_esfuture0610larger.png

This flash crash was not an exceptional event. We witness these types of market moves regularly, and in a wide variety of markets. And most of the time they happen even faster than the notorious S&P 2010 move – markets collapsing in a matter of seconds instead of 20 minutes. In 2017, for instance, COMEX Silver declined 10% on the evening of 6 July, and the Taiwan Weighted Index experienced a similar flash crash on 3 August.

Is such volatility harmful or beneficial to an investment program? It depends. If you do not trade in such flash crashes, it will not impact your returns. However, suppose you were invested in the S&P 500 at the beginning of 2010, you sold your stocks at the bottom of the flash crash and you bought them back right after the recovery. That action alone would have cost you around half your 2010 return.

We believe that it requires an active approach to prevent damage from flash crashes.

Actief of passief? (2017)

Lees meer

For some investors, this observation is one of the reasons to embrace a passive investment approach. But a passive approach – unless passive should be interpreted as “do not invest at all” – does not protect against losing in a flash crash. A passive approach requires transactions too. And you don’t want these transactions to be executed at the wrong time in a flash crash. The S&P flash crash in 2010 was triggered and fueled by a large mutual fund that wasn’t known for being typically active. Nonetheless, according to a SEC/CFTC report¹, it sold a total of 75,000 E-Mini S&P contracts (valued at approximately $4.1 billion) without regard to price or time. And on 24 August 2015 some U.S. Equity ETFs fell more than 40% in a short time period; these instruments are assumed to serve passive investors.

Graph 2: Flash crash in the Guggenheim S&P 500 Equal Weighted ETF on 24 August 2015

volat_rspstocklarger.png

We believe that it requires an active approach to prevent damage from flash crashes. Such an active approach should at a minimum include the possibility to refrain from executing against bad prices in a temporarily disrupted market. To even profit from flash crash-type volatility – and at the same time to act as a stabilizing force – requires buying in a flash crash. Not pulling away bids, but bringing in more bids in a falling market.

Verantwoord beleggen

Lees meer

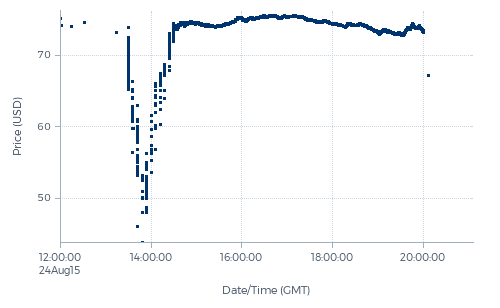
But as it turns out, this approach – even if executed well – is not always profitable. For example, in the Silver flash crash in July, our Diversified Trend Program (DTP) was one of the largest buyers, all the way down to the bottom. Regretfully, the exchange felt it necessary to adjust all prices traded in the flash crash upwards, effectively enabling everyone who sold in the crash to make a profit, irrespective of the disruptive manner in which they executed their orders. Although we do acknowledge that the exchange has the legal right to intervene in such manner, we firmly expressed our disagreement and concern. We strongly believe that such intervention undermines the proper functioning and fairness of the market.

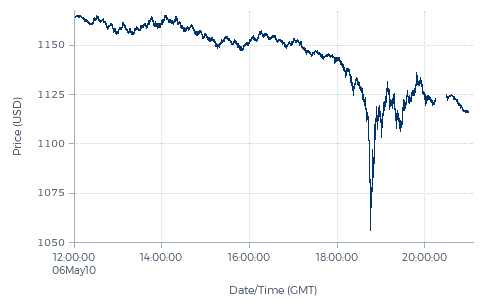
The flash crash-type volatility, however, is not the type of volatility we are specifically aiming to capture with our investment programs. But since these flash crashes do happen regularly, it is essential to ensure that we do not contribute to them and that we do not lose money because of them. Our execution strategies are designed to prevent that from happening. And as a bonus, we regularly are even able to profit from short-lived spikes and flash crashes.

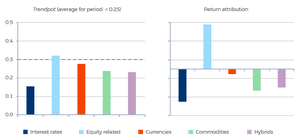
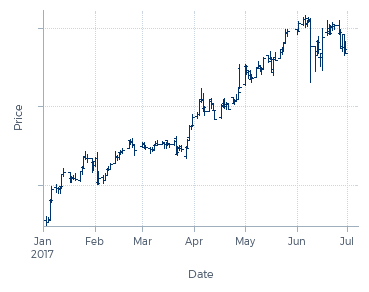
What is the type of volatility we are really after? The market volatility shaped as trends. In other words, a significant price move from one price level to another – either higher or lower – that takes some time to complete. At least a few weeks, but preferably somewhat longer. Some call this directional volatility. Such volatility is not measured by the traditional volatility measures, but is effectively captured by our trendpot measure, which we introduced in 2010. Trends such as defined above result in a high trendpot figure. And by the way, the hypothetical zero-volatility 0.1% daily price rise or fall mentioned earlier would do so as well. Spikes and flash crashes, on the other hand, typically do not impact trendpot.

Trendpot research paper (2010)

Lees meer
Graph 3: Trendpot and return attribution per cluster for DTP over the period January through September 2017 – long-term average trendpot = 0.3

Trendpot_return.png

Getting to the point: was there a “lack of volatility” during the first nine months of 2017? As illustrated by Graph 3, the markets traded in DTP indeed showed, on average, a low trendpot. But equity markets were the exception – the average trendpot in that cluster was high. And DTP profited well from that. Does this mean that there was a lot of volatility in the equity markets in 2017? Some observers did come to a different conclusion. We would argue that this again is above all a matter of definition and the chosen way of measuring.

A technology stock like Amazon, for example, rose more than 25% during the first six months of 2017. Meanwhile, retailers like Macy's and Foot Locker declined more than 30%. These market moves are related, effectively being part of one and the same trend. We call this a decent amount of volatility. If you put these stocks together in an index, however, the decline of the retailers offsets a part of Amazon’s rise. And gone is the volatility. So, investors concentrating on broad, large-cap indices may tell a different volatility story than those who have the freedom to pick individual stocks. Both stories are true.

Graph 4: Amazon in first half of 2017

volat_AZOlarger.png

Graph 5: Macy's in first half of 2017

volat_FDlarger.png

Which brings us to the final part of our volatility story. The volatility of an investment program is not dictated by the volatility of the markets traded. It first and foremost depends on the choices made by the investment manager. In fact, volatility is one of the easiest-to-control outcomes of an investment program. Of course, it is always a compelling story to tell as an investment manager that you strive for the highest return with low volatility. But that really should be regarded as just marketing talk.

Markets may or may not be less volatile than they used to be. But we believe that there is still enough volatility available for investors, although it might nowadays often be different in appearance.

Without an adequate amount of volatility in an investment program, a significant investment return should not be expected. And if we want to get this required volatility in our investment programs, we should not shy away from the volatility offered to us by the market. We all know what type of events typically offer volatility: elections or a referendum such as on Brexit, interest rate decisions by central banks, OPEC meetings, crop reports, quarterly results of companies, etcetera. We could reduce our positions ahead of such events, referring to proper risk management, but we regard this as a clear case of throwing out the baby with the bathwater.

Markets may or may not be less volatile than they used to be. But we believe that there is still enough volatility available for investors, although it might nowadays often be different in appearance. It is up to us to profit from that volatility as efficiently as possible. Given the evolving appearance of volatility, this requires adequate adaptation of the investment strategies we design. Shying away from market risk is most certainly not on our list of solutions.

High on our list of practiced solutions is diversification. We aim to hold different, sizable positions in different trends. Unlike reducing positions, this strategy does not guarantee a reduced loss when there is a large reaction in a trend. However, while not guaranteed, very often it still does reduce losses. Perhaps more importantly, unlike reducing position sizes, this strategy does not reduce the upside to the same extent as the downside. Well-chosen diversifying positions can even add to the upside. Consequently, when volatility emerges – or in Transtrend terms, when the trendpot is high – DTP has the ability to profit from that with a significant return.

  • Source of price, trendpot and return attribution data used in the graphs in this article: Thomson Reuters, Bloomberg and Transtrend.

¹ “Findings regarding the market events of May 6, 2010”, published on 30 September 2010.