In February the XXIII Olympic Winter Games will be held in Pyeongchang. Here in the Netherlands all eyes will be on the speed skating events. It is our national sport.
The crucial element in skating is the ice rink. Obviously, the ice sheet needs to be very slippery. For people without ice skates, as for skaters who lack the skill, this constitutes a risk. One is likely to fall and fracture a bone. However, for trained speed skaters this very same slipperiness offers the opportunity to gain speed. The Olympic champions will achieve speeds up to 60 km per hour.
The risk-return relationship of speed skating is comparable to that of investing. Instead of slippery ice, the investor’s course offers market risk. The skill in taking on that risk determines the difference between winning and losing.
Once I had the privilege of skating with former Olympic champion Tomas Gustafson for a day. Not on an oval with resurfaced ice, but on a vast and desolate lake in Sweden. He took the lead; I tried to stay in his wake. On the stretches covered with snow and studded with cracks, I was able to keep up with him. But where the wind had blown away the snow, leaving a black mirror to skate on, he outpaced me. My technique is good enough to keep me on my feet, but not good enough to gain real speed. This is good for an amateur, but not enough for Olympic ambitions.
This can be translated into investment skills as well. Risk, volatility, and drawdowns are often directly connected. And indeed, if leverage were the only parameter, larger leverage would directly translate into higher volatility, higher risk, and deeper drawdowns. And also into larger returns, either positive or negative. However, in reality other parameters can determine different relationships, above all between volatility and drawdowns.
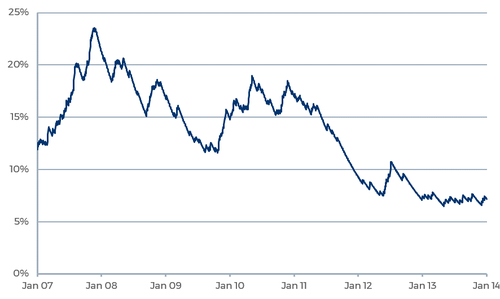
Graph 1 – Volatility of DTP: number of days (%) with absolute net return DTP >1% in rolling 250-day period
Graph 1 expresses the historical volatility of our Diversified Trend Program (DTP).¹ It shows that the program’s daily volatility was much lower around 2013 than it was around 2007. But that did not translate into lower drawdowns (see Graph 2 below).² A large drawdown with high volatility is a natural relationship. Whoever skates fast can fall hard. Get back on your feet quickly, and no harm is done. However, if an investment program makes a 15% drawdown with low volatility, then something is fundamentally wrong.
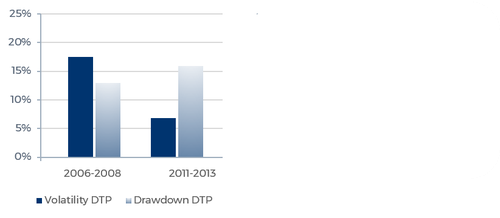
Graph 2 - Volatility and maximum drawdown of DTP in the 3-year periods 2006-2008 and 2011-2013
Just like in the skating analogy, there can be various causes for such a distorted relationship between volatility (= speed) and drawdown (= falling behind). It could be that the skater does not get back on his feet so fast after making a fall. It could be that he slows down for a while after falling, afraid to fall again. It could be that he slows down every time he spots some cracks, or snow, or whenever he has to make a turn. Or it could be that he just lacks the skills to benefit optimally from the good opportunities offered by the frozen lake. In modern investments this is called negative alpha.
The largest part of the maximum drawdown in the 2006-2008 period occurred in a matter of days, from 27 February through 5 March 2007. DTP fully recovered from this drawdown in just over two months. A clear illustration of what it means to ‘fall and get up quickly’. The 2011-2013 drawdown, however, kept increasing gradually with low volatility, from 4 March 2011 (peak) until 6 February 2014 (valley). Such a deep drawdown lasting a few years from top to bottom while its daily returns show low volatility does not indicate an investment strategy that takes on risk in an efficient way to earn a risk premium. On the contrary, it signifies a strategy that avoids market risk and pays a premium for that.
Volatility and risk are not the same thing. Lower volatility is often a better explanatory variable for lower returns than a measure of lower risk.
Experiencing the disappointing performance of DTP in these years, we initially blamed the metaphorical ice. The quantitative easing policies by the Fed and other central banks made it hard for trend following strategies like DTP to perform. We expected this to be a temporary phenomenon. When QE would end, we would reach good ice conditions again. Meanwhile we were hoodwinked by the low volatility of the program; it unduly reassured us that the risk was still well under control. The conditions may temporarily be harder – a lot of cracks and a lot of snow – but we did not fall.
In the first half of 2013 we realized that it was not just QE. The market dynamics had changed. And most of these changes were likely to be structural. We had to adapt our program to these changes if we wanted it to be able to cope with them. On the Swedish lake, Tomas Gustafson did not wear the same skates that had delivered the gold medal to him on the Olympic Oval in Calgary. Nor did he apply the exact same skating technique. A changed environment requires an appropriately adapted technique.
We also realized that the declined volatility of the program was not such a good sign after all. It simply meant that we had not been skating fast enough. There may have been longer-than-average stretches covered with snow, but there had been stretches of shining black ice in between that we had not benefited from well enough. For instance in the second quarter of 2012. The idea that the returns that DTP had made in the years around 2007 would be feasible without the accompanying volatility had been wishful thinking.
This awareness inspired us to make a whole suite of changes. All aimed at making sure that, despite the changed market dynamics, the program should be able to be sizably invested in different trends again. Such sizable positions would restore volatility to the program. Volatility that is required – but no guarantee – for good returns.
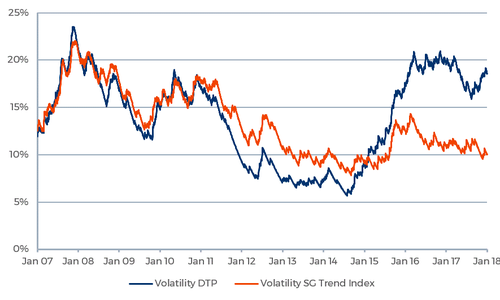
Graph 3 – Volatility of DTP and SG Trend Index: number of days (%) with absolute net return DTP (SG Trend Index) >1% in rolling 250-day period
As illustrated by Graph 3, the daily volatility of DTP did increase again from its low levels around 2013.³ This did not go unnoticed. Some of our investors understandably worried that this higher volatility would be reflected in deeper drawdowns. As illustrated by Graph 4, this has not been the case.⁴
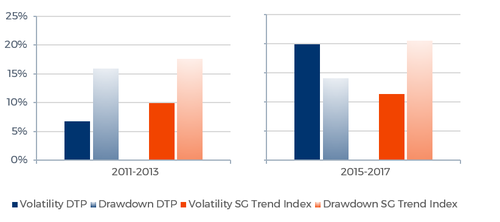
Graph 4 - Volatility and maximum drawdown of DTP and SG Trend Index in the 3-year periods 2011-2013 and 2015-2017
Of course, theoretically this absence of deeper drawdowns may also be explained by a lack of serious cracks. However, a look at the SG Trend Index tells a different story (see Graph 4). The average trend following program comprising this index even made its deepest drawdown in the past few years.
And this brings us back to the lesson learned on a frozen Swedish lake. Sharp deep drawdowns can be explained by volatility. Long-running drawdowns with low volatility, however, indicate a fear of volatility and a lack of skill. As such, volatility and drawdowns are not necessarily two sides of the same medal.
Source of all data used in the graphs in this article: BarclayHedge and Transtrend.
Footnotes
¹ For each 250-trading-day period, the total number of trading days (expressed as a percentage) on which the net composite return of DTP – Enhanced Risk (USD) was >1% or <-1% is calculated. The graph shows the resulting time series, exponentially smoothed.
² Volatility is calculated as the total number of trading days (expressed as a percentage) on which the net composite return of DTP – Enhanced Risk (USD) was >1% or <-1% for each 3-year period. The maximum drawdowns are peak-to-valley figures, based on the daily net composite returns of DTP – Enhanced Risk (USD). For the period 2006-2008: 12.95% from 18 January 2007 (peak) through 5 March 2007 (valley); for the period 2011-2013: 15.91% from 4 March 2011 through 6 February 2014.
³ Calculated the same way as the time series in Graph 1.
⁴ Calculated the same way as the statistics in Graph 2. Maximum drawdown DTP for the period 2011-2013: 15.91% from 4 March 2011 (peak) through 6 February 2014 (valley); for the period 2015-2017: 14.12% from 10 August 2016 through 6 July 2017. Maximum drawdown SG Trend Index for the period 2011-2013: 17.67% from 4 November 2010 through 24 March 2014; for the period 2015-2017: 20.51% from 13 April 2015 through 6 July 2017.
All composite performance data of DTP presented in this article should be viewed in conjunction with theexplanatory notes, which are an integral part of this performance data.
All SG Trend Index performance data should be viewed in conjunction withthedescription of indices used.
THE VALUE OF YOUR INVESTMENT CAN FLUCTUATE. PAST PERFORMANCE IS NOT NECESSARILY INDICATIVE OF FUTURE RESULTS.
We use cookies to ensure that you enjoy the best experience on our website. We do not use any third party cookies.
Our website may, however, include hyperlinks to external websites that use third party cookies.
For further information, please read our
Privacy statement
and
Terms of use.